系统性能监控:Prometheus + Grafana 监控服务器性能
Prometheus 是一个开源的服务监控系统和时间序列数据库,是一款开源系统监控和警报工具,在测试领域中,我们可以使用Promethues来监控压力测试时服务端的性能。
Prometheus简介
Prometheus使用Go语言开发,是最初在SoundCloud上构建的开源系统监控和警报工具,在2016年加入了Cloud Native Computing Foundation(CNCF)基金会,是继Kubernetes之后该基金会的第二个托管项目。
主要特性
多维数据模型,由指标名称和键值对标识的时间序列数据度量
PromQL查询语言
不依赖分布式存储;单个服务器节点是自治的
通过HTTP使用pull模式收集时间序列数据
支持通过中间网关推送时间序列数据
通过服务发现或静态配置发现目标对象
支持多种图形和仪表盘
组成
Prometheus由多个组件组成:
Prometheus主服务器:用于抓取并存储时间序列数据
客户端库:用于检测应用程序代码
推送网关:支持短生命周期
各种exporter:HAProxy,StatsD,Graphite等服务收集服务器性能数据
警告管理器
各种支持工具
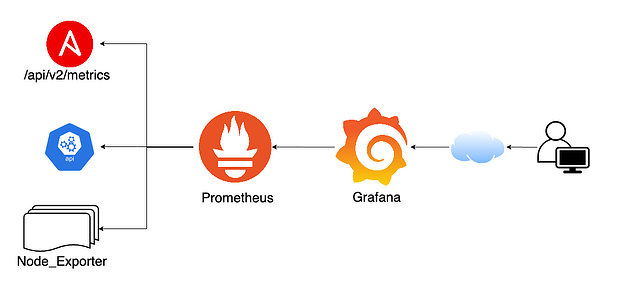
架构

Prometheus + Grafana 监控系统性能
主要用到了Prometheus,node exporter和Grafana,Prometheus和node exporter收集保存服务器性能数据,Grafana用于图形化展示数据。
docker安装Prometheus
docker hub地址:https://registry.hub.docker.com/r/prom/prometheus
docker安装:
$ docker pull prom/prometheus
配置prometheus.yml文件
参考:https://github.com/prometheus/prometheus/blob/main/documentation/examples/prometheus.yml
新建/root/prometheus/prometheus.yml文件:
# my global config
global:
  scrape_interval:     15s # Set the scrape interval to every 15 seconds. Default is every 1 minute.
  evaluation_interval: 15s # Evaluate rules every 15 seconds. The default is every 1 minute.
  # scrape_timeout is set to the global default (10s).

# Alertmanager configuration
alerting:
  alertmanagers:
  - static_configs:
    - targets:
      # - alertmanager:9093

# Load rules once and periodically evaluate them according to the global 'evaluation_interval'.
rule_files:
  # - "first_rules.yml"
  # - "second_rules.yml"

# A scrape configuration containing exactly one endpoint to scrape:
# Here it's Prometheus itself.
scrape_configs:
  # The job name is added as a label `job=<job_name>` to any timeseries scraped from this config.
  - job_name: 'prometheus'

    # metrics_path defaults to '/metrics'
    # scheme defaults to 'http'.

    static_configs:
    - targets: ['localhost:9090']
启动prometheus
我们要用Grafana展示prometheus监控数据,先启动Grafana,Grafana安装配置方法可参考:JMeter性能监控系统:Jmeter + InfluxDB + Grafana
启动命令:
$ docker run -d -p 3000:3000 --name=grafana --network=grafana grafana/grafana:latest
启动prometheus:
$ docker run -d --name prometheus --network grafana -p 9090:9090 -v /root/prometheus/prometheus.yml:/etc/prometheus/prometheus.yml prom/prometheus:latest --config.file=/etc/prometheus/prometheus.yml
启动后使用docker ps查看是否启动成功
[root@server prometheus]# docker ps
CONTAINER ID   IMAGE                    COMMAND                  CREATED              STATUS              PORTS                    NAMES
0587156618c5   prom/prometheus:latest   "/bin/prometheus --c…"   About a minute ago   Up About a minute   0.0.0.0:9090->9090/tcp   prometheus
[root@server prometheus]#
浏览器访问:http://192.168.30.8:9090/ 其中192.168.30.8是我的服务器主机ip地址
 metrics为本地主机的数据,访问http://192.168.30.8:9090/metrics 可以查看采集的数据。
安装启动node exporter
node exporter用于收集系统数据,下面介绍它的使用方法。
node exporter github地址:https://github.com/prometheus/node_exporter
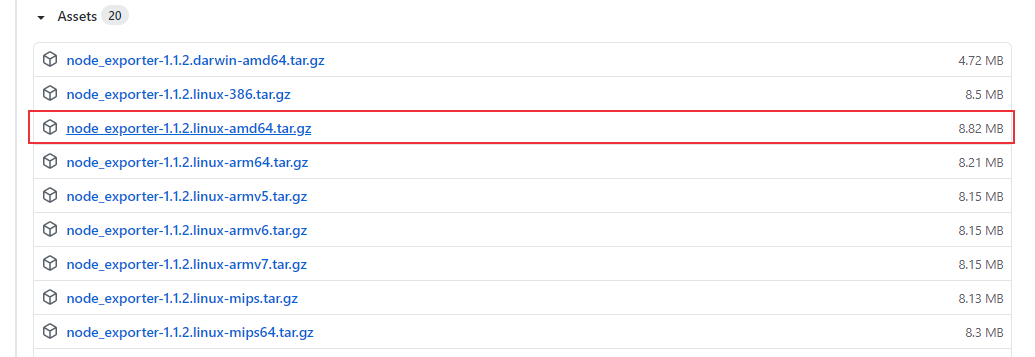 下载node_exporter-1.1.2.linux-amd64.tar.gz,安装到另一台Linux系统上
[root@Server2 exporter]# tar -xvzf node_exporter-1.1.2.linux-amd64.tar.gz
node_exporter-1.1.2.linux-amd64/
node_exporter-1.1.2.linux-amd64/LICENSE
node_exporter-1.1.2.linux-amd64/NOTICE
node_exporter-1.1.2.linux-amd64/node_exporter
[root@Server2 exporter]# cd node_exporter-1.1.2.linux-amd64/
[root@Server2 node_exporter-1.1.2.linux-amd64]# ls
LICENSE  node_exporter  NOTICE
[root@Server2 node_exporter-1.1.2.linux-amd64]#
运行node exporter,端口号为9100(默认):
[root@Server2 node_exporter-1.1.2.linux-amd64]# nohup ./node_exporter --web.listen-address=":9100" &
启动后,浏览器输入http://192.168.30.9:9100/ 访问Node Exporter采集的数据,192.168.30.9为安装node exporter服务器的IP地址。
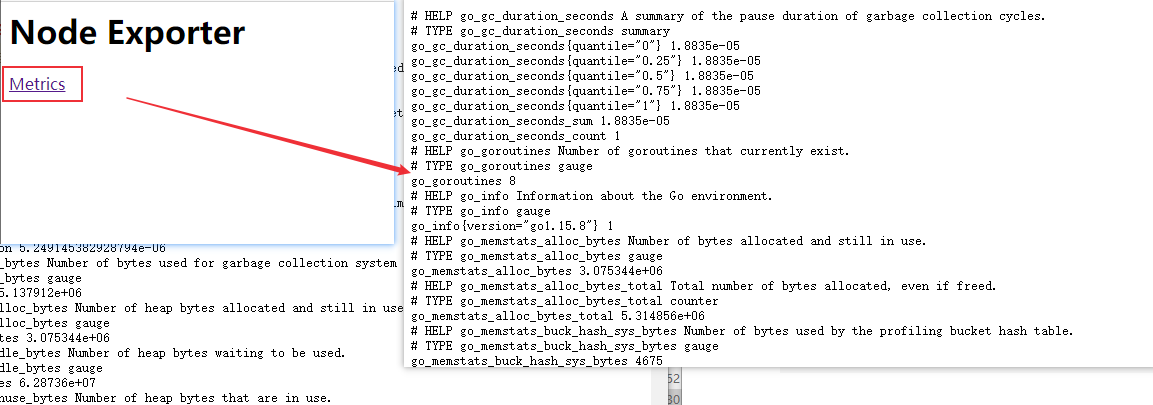
这时候在Prometheus是看不到这个节点的,因为没有建立连接,接下来配置prometheus.yml文件
配置Prometheus
配置前面创建的prometheus.yml文件(启动prometheus的那个服务器),在scrape_configs下添加:
scrape_configs:
  - job_name: 'prometheus'
    static_configs:
    - targets: ['localhost:9090']

  - job_name: 'centos server2'
    static_configs:
    - targets: ['192.168.30.9:9100']
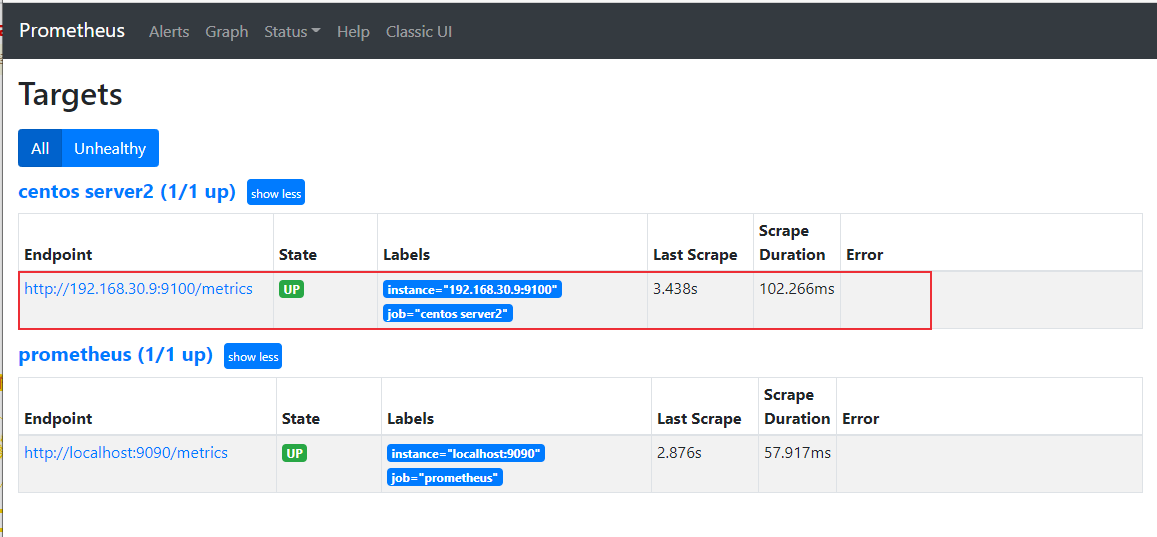
重启Prometheus:
$ docker restart prometheus
prometheus
重启成功后,刷新Prometheus页面,发现上线成功
配置Grafana
点击Configuration -> Data Sources -> Add data source 选择Prometheus
然后配置URL:http://prometheus:9090
修改抓取时间,查询超时时间等参数,设置完成后点击Save & Test

接下来配置Dashboard,在https://grafana.com/grafana/dashboards 中搜索选择别人开发好的面板,推荐https://grafana.com/grafana/dashboards/8919
点击Dashboards -> Manage -> Import,输入选择的dashboard地址,点击load,选择prometheus数据源,配置完成后点击Import。
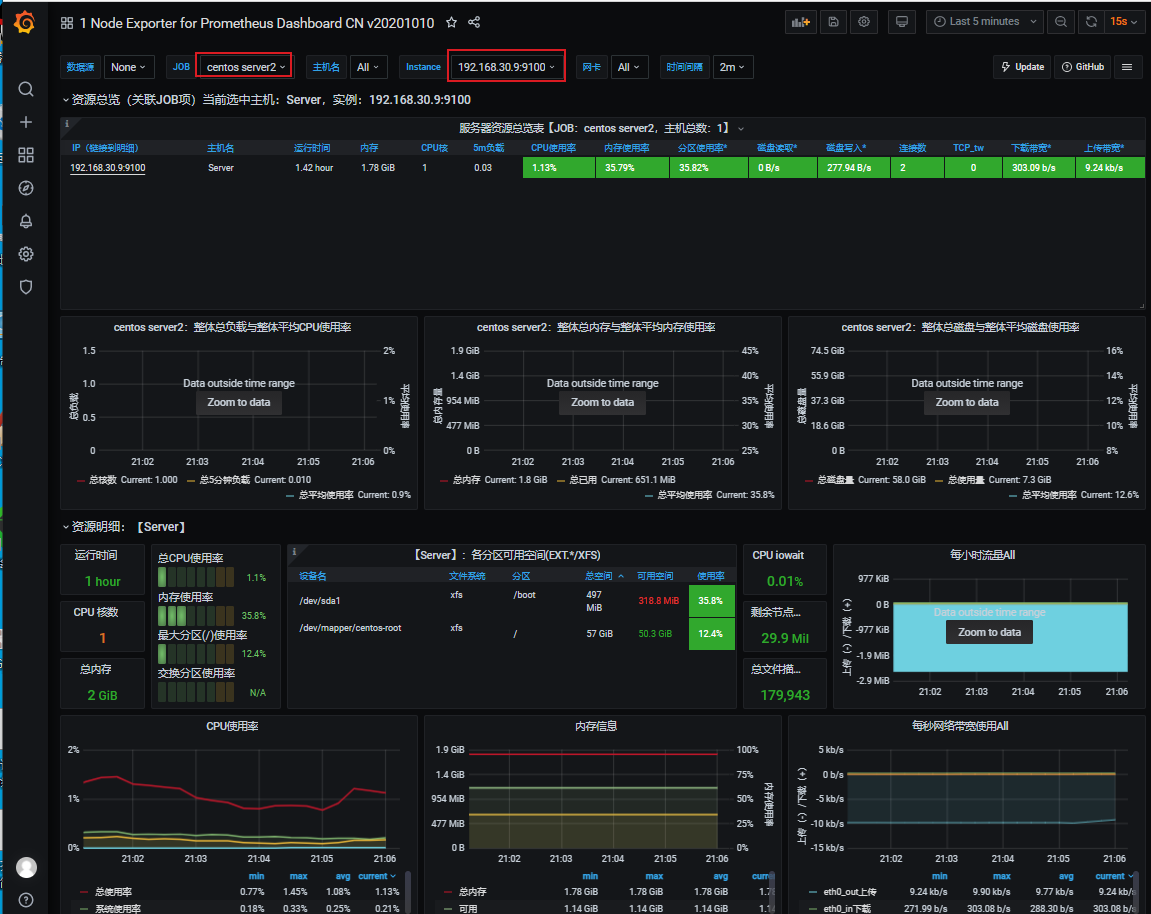
 监控界面显示:
小结
Prometheus提供了各种exporter,用于收集各种数据库、系统、中间件等性能数据,可参考https://prometheus.io/docs/instrumenting/exporters/ 查看所有官方或者第三方提供的exporter。